Registrieren Sie sich noch heute für die PU Xtrader Challenge
Handeln Sie mit simuliertem Kapital und verdienen Sie echte Gewinne, nachdem Sie unsere Händlerbewertung bestanden haben.
Registrieren Sie sich noch heute für die PU Xtrader Challenge
Handeln Sie mit simuliertem Kapital und verdienen Sie echte Gewinne, nachdem Sie unsere Händlerbewertung bestanden haben.
22 March 2023,07:27
Daily Market Analysis
Wall Street closed high and gold prices retraced as the fears over the banking sector crisis abated; the dollar index remains calm before the Fed’s interest rate decision announcement, which will be made later today (22nd March). However, investors are starting to discuss the banking turmoil as aftermath of central banks’ frenetic rate hikes a year ago – markets now perceive an 80% chance the Fed will opt for a 25 bps hike as compared to a 50 bps hike a month ago, according to a pool from CME FedWatch Tool. Economists also argued that the Fed might have a chance to pause its monetary tightening cycle to assess the damage and the extent of its steep rate hike in the past year. On the other hand, oil prices ended their 2-session bullish run awaiting the Fed interest rate decision, with investors eyeing the result of the meeting between China and Russia’s top leaders. Peace in the region or abolishing Russian sanctions from the western world may ease the oil supplies and affect oil prices.
Current rate hike bets on 22nd March Fed interest rate decision:
0 bps (12.2%) VS 25 bps (87.8%)


The safe-haven US dollar retreated as concerns over liquidity in the banking sector subsided. The rout in banking stocks that was sparked by regional bank failures last week, had raised fears of contagion in the financial sector. However, after US Treasury Secretary Janet Yellen pledged to offer support to smaller banks in the event of bank runs, First Republic Bank saw its shares surge by about 30% on Monday, leading the way for other banking stocks to bounce back aggressively. This improved the risk appetite in global financial markets, with investors shifting their portfolios into riskier assets.
The Dollar Index is trading lower following the prior breakout below the previous support level. However, MACD has illustrated diminishing bearish momentum, while RSI is at 36, suggesting the index might enter the oversold territory.
Resistance level: 103.50, 104.15
Support level: 102.85, 102.15

Gold retreated as investors’ concerns over the stability of the global banking sector eased, leading to a decline in demand for safe-haven assets. The rebound in banking stocks, following Yellen’s comments on supporting smaller banks, fuelled a renewed appetite for riskier assets, prompting investors to shift their portfolios away from safe-haven assets like gold and into riskier assets.
Gold prices are trading lower following the prior breakout below the previous support level. MACD has illustrated increasing bearish momentum, while RSI is at 48, suggesting the commodity might extend its losses since the RSI retreated sharply from the overbought territory.
Resistance level: 1955.00, 2000.00
Support level: 1925.00, 1905.00
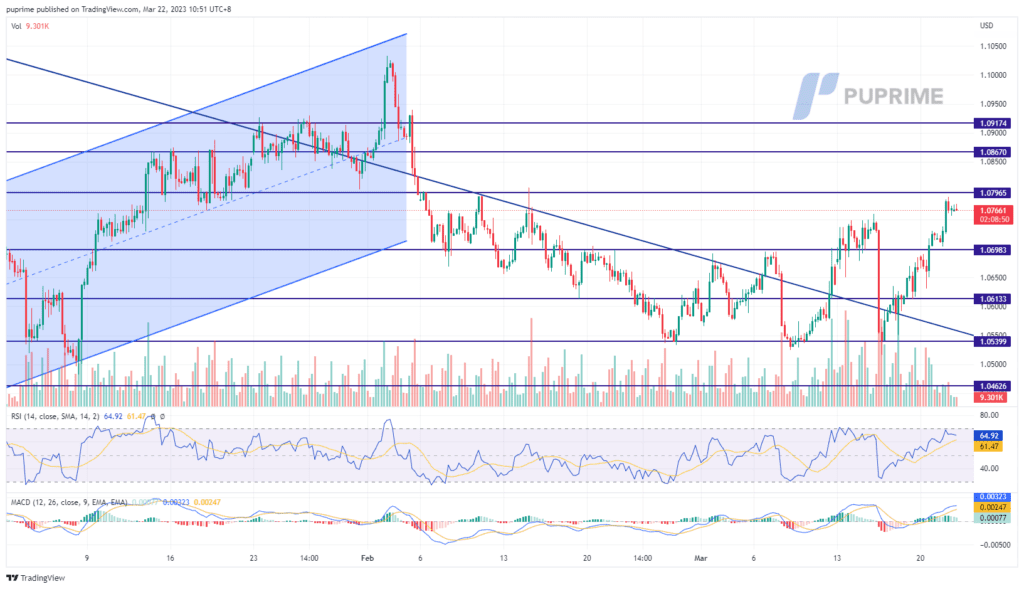
The euro continues to be bullish against the dollar, buoying above 1.075 ahead of the Fed interest rate decision announcement, which will be announced later today (22nd March). The dollar lacks a catalyst and continues to be soft, especially after the banking crisis reverberated in the financial market. According to a pool from the CME FedWatch tool, there is more than 80% chance the Fed may go for a 25 bps rate hike compared to a 50 bps hike a month ago before the crisis broke out. The market also started to discuss a pause of the monetary tightening cycle from the Fed which may further weaken the dollar. A dovish move from the Fed potentially sends the euro to trade above 1.0800 against the dollar.
Although the euro has gained more than 1% in the previous 3 sessions, the indicators depict a slowdown in bullish momentum for the pair. The RSI stays flat when it reaches near to the overbought zone and the gap between the MACD and the Signal line is narrowed.
Resistance level: 1.0796, 1.0867
Support level: 1.0698, 1.0613
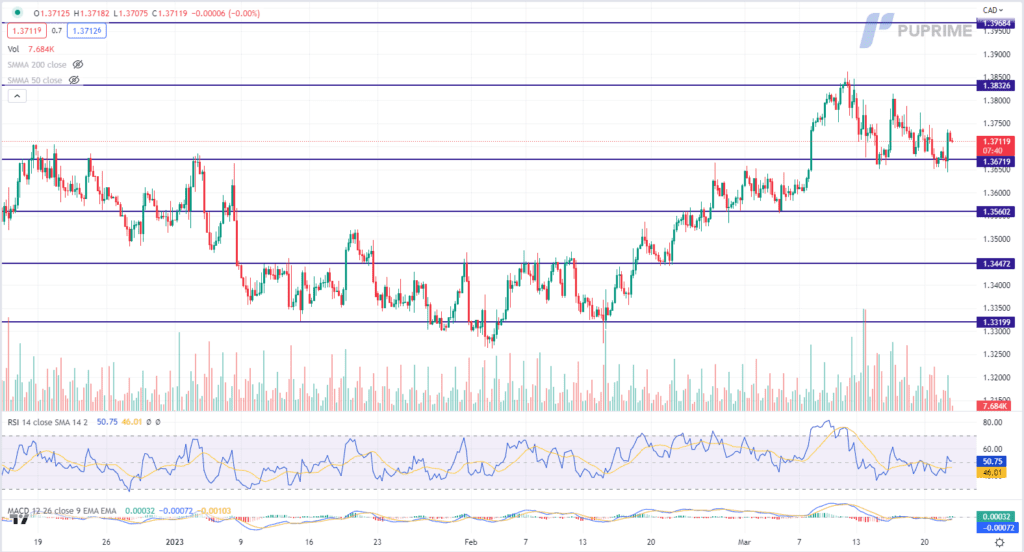
The Canadian Dollar has experienced a selloff amidst the release of disappointing inflation data by Statistics Canada. The country’s inflation rate has slowed more than anticipated, hitting its lowest point in over a year. In February, the annual inflation rate plummeted to 5.2% from the previous month’s figure of 5.9%, marking the most substantial single month decline in almost three years. This was also below the market’s projected rate of 5.4%.
USDCAD is trading higher following the prior rebound from the support level. MACD has illustrated increasing bullish momentum, while RSI is at 51, suggesting the pair might extend its gains since the RSI stays above the midline.
Resistance level: 1.3835, 1.3970
Support level: 1.3670, 1.3560
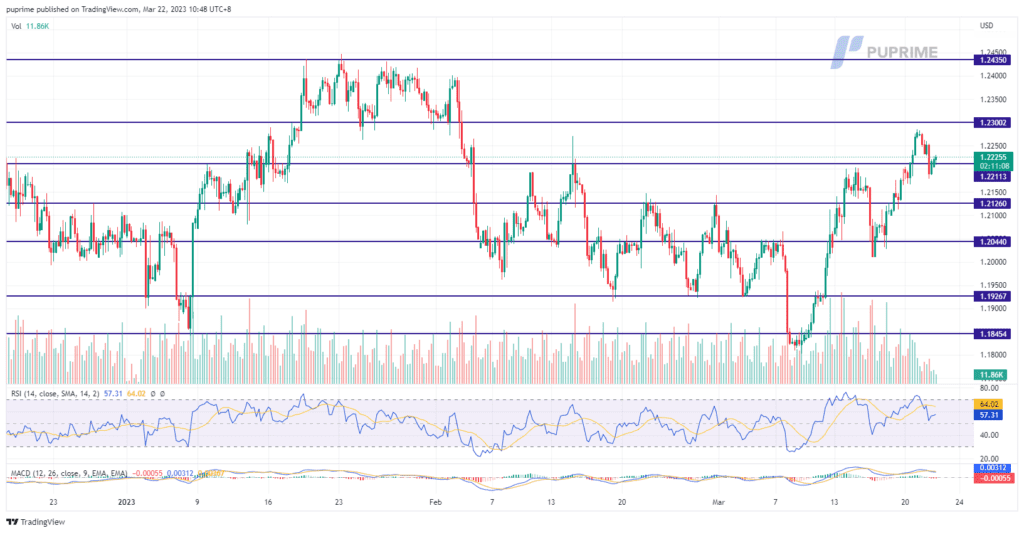
The pound dropped 0.23% to $1.2223 against the dollar on Tuesday as market participants await the Federal Reserve’s rate hike decision. On the UK side, traders bet the BoE would keep the rate unchanged or increase by 25 basis points on Thursday. Furthermore, UK’s CPI data will be released later today, and investors are suggested to keep an eye on it. Market participants expect the UK inflation data to show some easing amid the global financial market instability. In addition, the market predicts the central bank is done with its tightening cycle, leading to the pound halting its gains.
Moreover, the pound has retreated, touching the support level of $1.2211 and now trading at $1.2223 as of writing. MACD has illustrated a neutral momentum ahead. RSI is at 56, indicating the pair’s movement slows down.
Resistance level: 1.2300, 1.2441
Support level: 1.2211, 1.2126
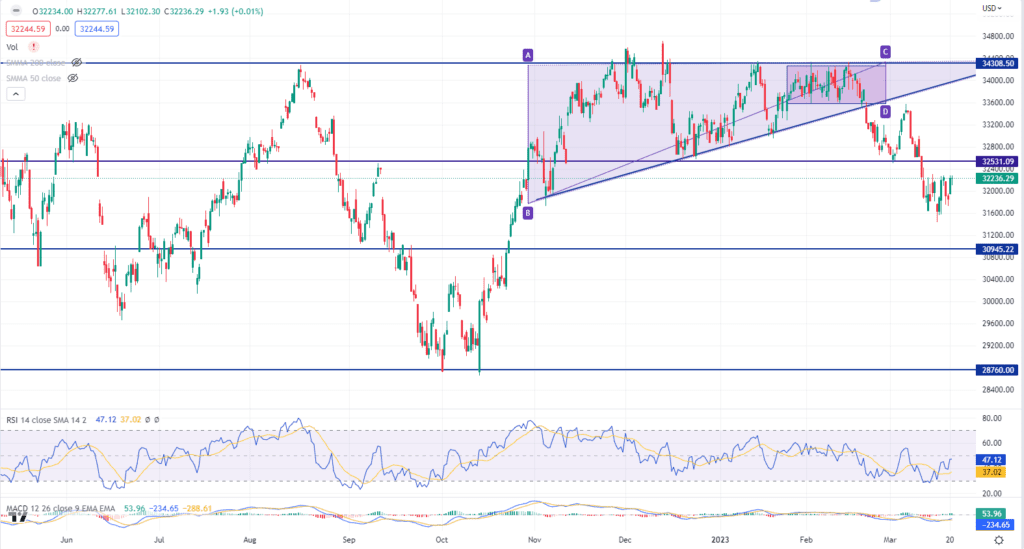
The Dow Jones Industrial Average staged an impressive rebound on Monday, buoyed by a surge in risk appetite following the alleviation of liquidity concerns in the banking sector. Investors breathed a sigh of relief after US Treasury Secretary Janet Yellen extended a pledge to provide support to smaller banks during potential bank runs. The market responded positively, propelling First Republic Bank’s shares to soar by a staggering 30%, and spurring a domino effect across the banking sector. The consequent surge in risk appetite leading to a notable shift in portfolio allocations towards riskier assets across global financial markets.
The Dow is trading higher while currently testing the resistance level. MACD has illustrated increasing bullish momentum, while RSI is at 53, suggesting the index might extend its gains after it successfully breakout the resistance level.
Resistance level: 32545.00, 34310.00
Support level: 30945.00, 28760.00
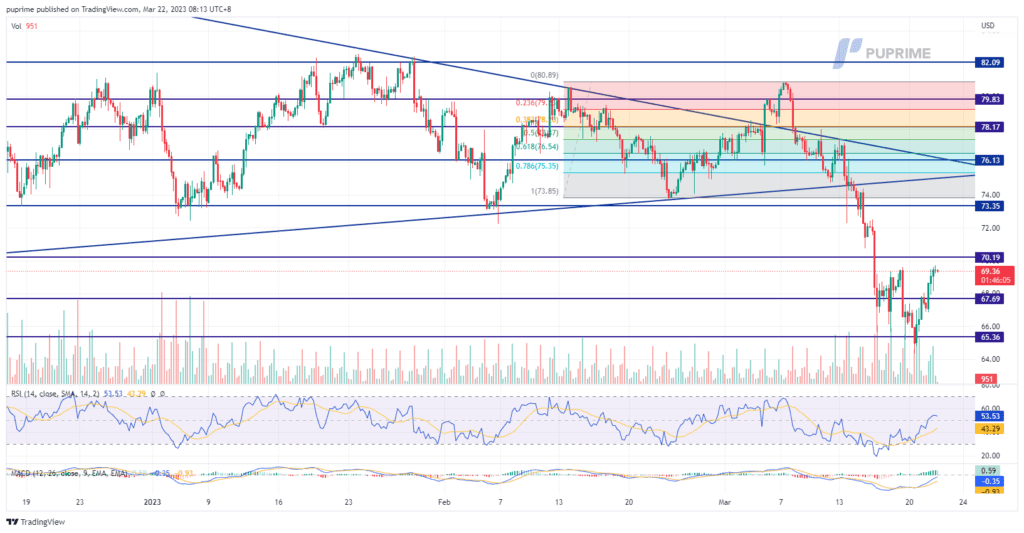
Oil prices experienced their sharpest increase since early February, with a 3.53% rebound on Tuesday, following the U.S. government’s promise to backstop deposits at other U.S. lenders. The move helped to ease concerns over financial stability and calm market fear. Further strengthening crude oil prices, Russia announced extending its 500,000 barrel-a-day crude output cut through June, while domestic refinery runs have shown little signs of output reductions. Meanwhile, The Federal Reserve’s interest rate decision on Wednesday and its expected effect on the economic environment will likely move crude prices further.
Oil prices rally and cross above the resistance level, trading at $69.33 as of writing. The market seems like a ‘risk back on’ appetite after the U.S. government announced they would backstop deposits in other U.S. banks to calm market fear. The prices were trading in a volatile movement as the market was ahead of the Fed’s dovish rate hike decision. MACD has increasing bullish momentum, while RSI is at 53, indicating the pair is moving upward in the short term.
Resistance level: 70.19, 73.35
Support level: 67.69, 65.36

Trade forex, indices, cryptocurrencies, and more at industry-low spreads and lightning-fast execution.

8 August 2023, 06:21 U.S. Equity Market Closes Higher Ahead of CPI

7 August 2023, 06:10 Dollar Softer After NFP Comes Short

4 August 2023, 06:20 BoE Delivers 25 BPS Rate Hikes Softening Pound Sterling

Neue Registrierungen nicht verfügbar
Wir akzeptieren derzeit keine neuen Registrierungen.
Während neue Anmeldungen nicht verfügbar sind, können bestehende Nutzer ihre Herausforderungen und Handelsaktivitäten wie gewohnt fortsetzen.